The Elevation Heat Map overlay allows you to visualize elevation ranges by color; easily capturing differences in elevation or highlighting the elevation ranges you are most interested in.
How To Enable:
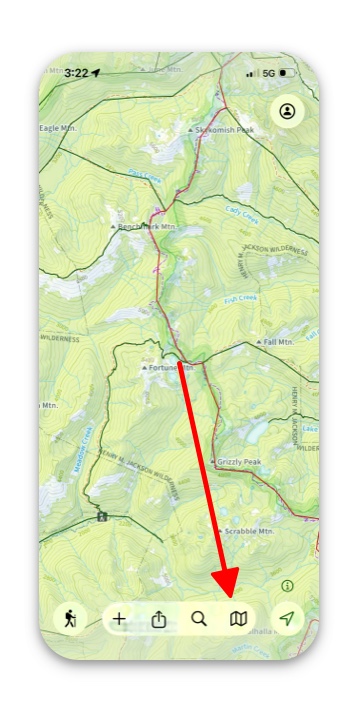
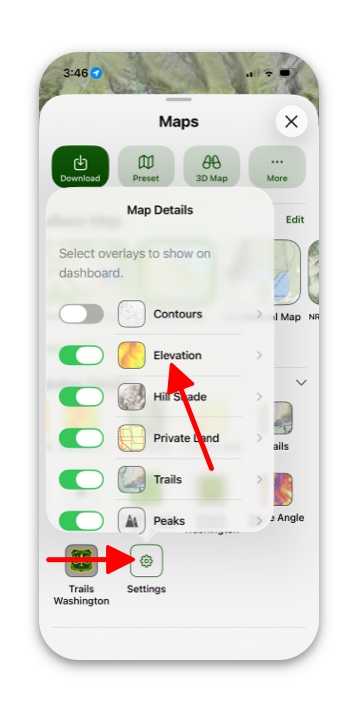
- Tap on the folded map icon in the bottom right corner.
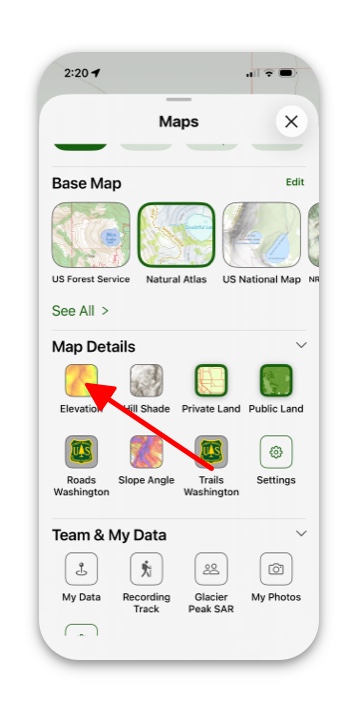
2. Under Map Details tap Elevation.
3. If not displayed there, then tap Settings under Map Details and toggle on Elevation.
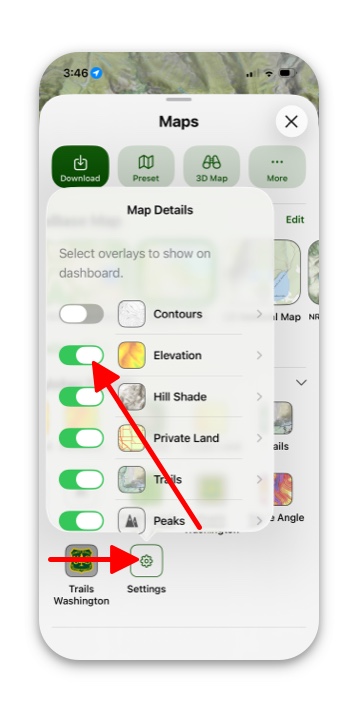
4. If you want to configure your colors then simply tap Settings under Map Details and then tap on Elevation.
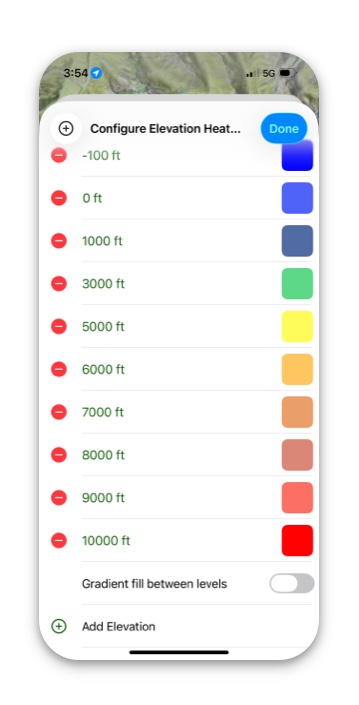
5. Next, tap on Configure Colors.
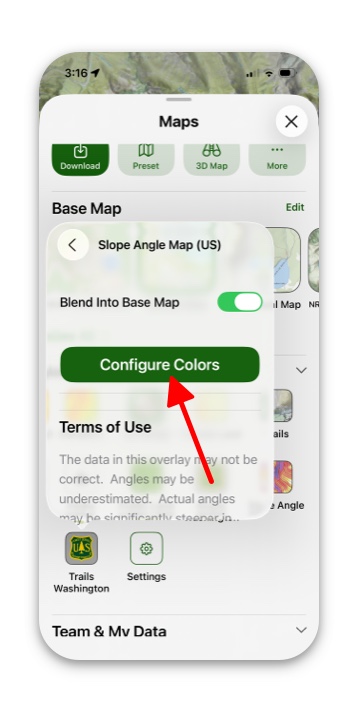
6. Here you can choose specific colors for certain elevations.