What Are Data Layers?
Data Layers are a powerful new feature in Topo Maps+ that allow you to create custom map visualizations based on attributes you define. With Data Layers, you can organize and visualize your mapping data in meaningful ways by defining attribute schemas and applying custom styles based on those attributes.
Creating a New Data Layer
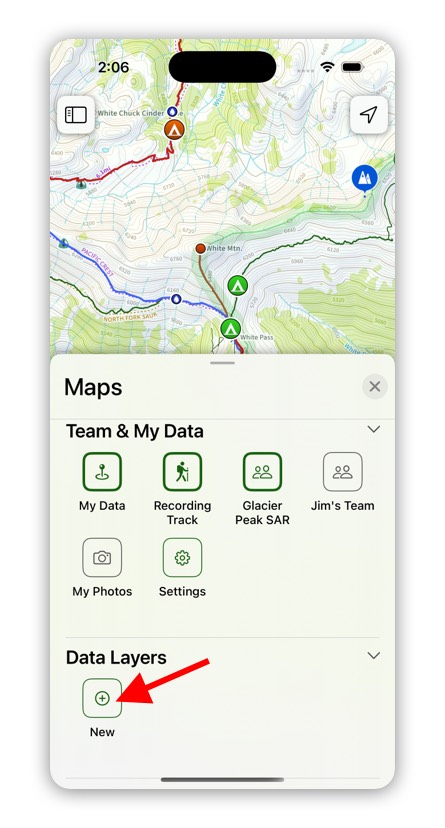
- Tap on the Map icon in the toolbar.
- Tap on the Plus icon in the Data Layers Section.
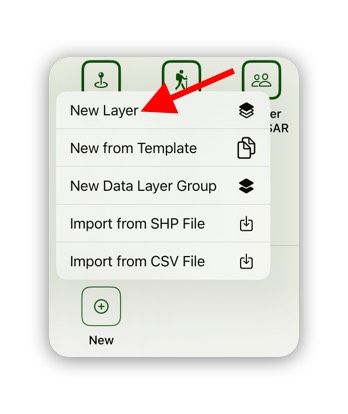
3. Select “New Layer”
4. Enter a name for the Data Layer
Data Layer Attribute Schema
An attribute schema defines what types of information you want to track for any map object in your Data Layer. For example, if you’re mapping hiking trails, you might want to track attributes like difficulty, surface type and trail conditions.
For an example, see our Wildlife Data Layer.
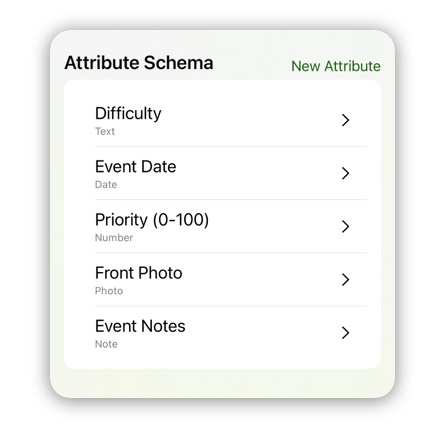
To add a new attribute tap on “New Attribute”.
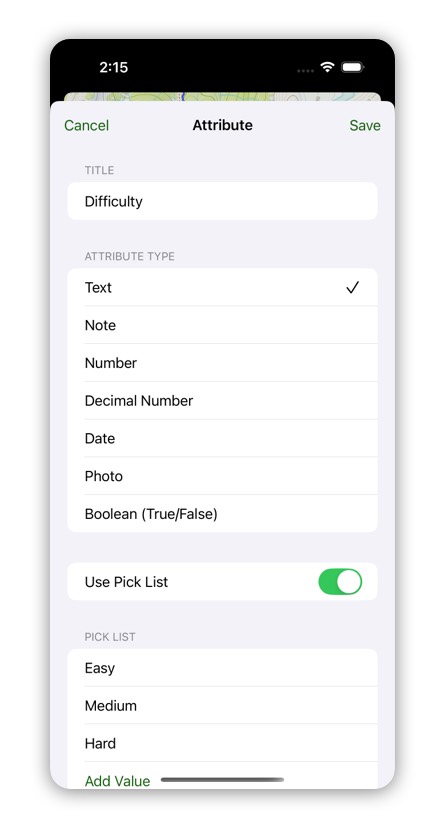
Then give the attribute a title and choose what type of data you want with this attribute.
For text attributes you can select to use a “Pick List”. A pick list lets you add some predefined list to pick. For example you can have your list be “Easy”, “Medium”, and “Hard.
You can continue to add attributes by tapping on “New Attribute”.
You can drag the attributes up/down to rearrange the order.
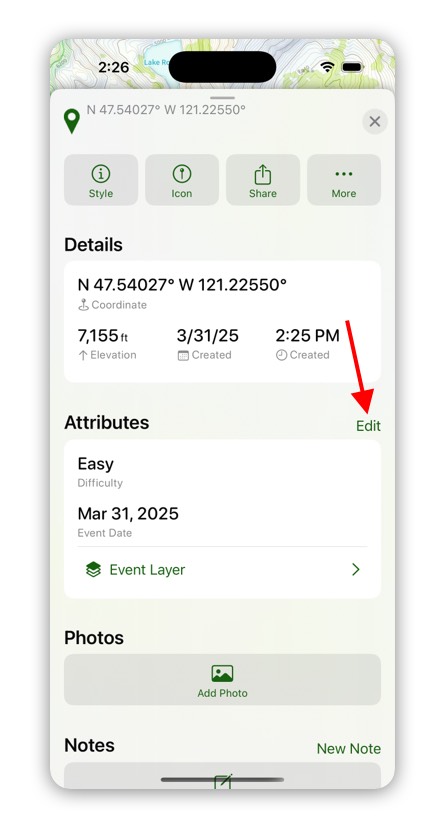
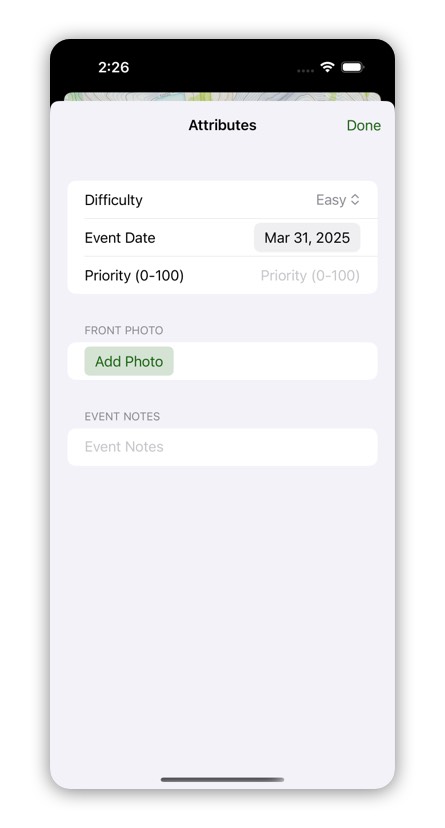
Data Layer Attributes
When you add a new map object (waypoint, route, or region) to a data layer you can set the values for each of the attributes.
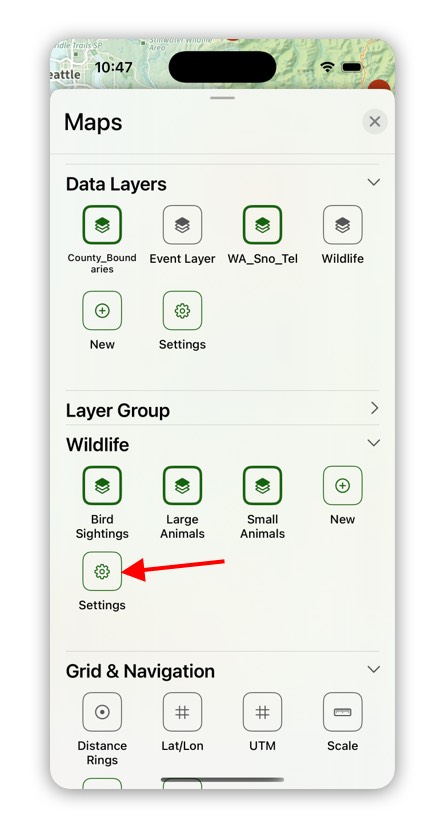
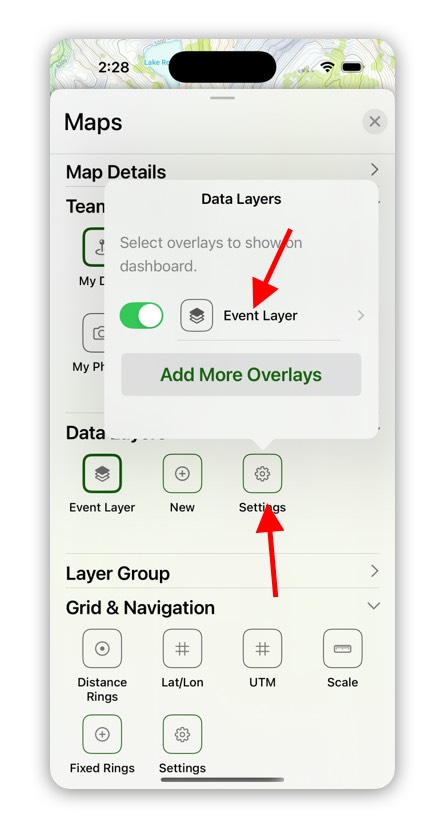
Data Layer Settings
You can access the data layer settings from the Advanced Maps -> Data Layers -> Settings.
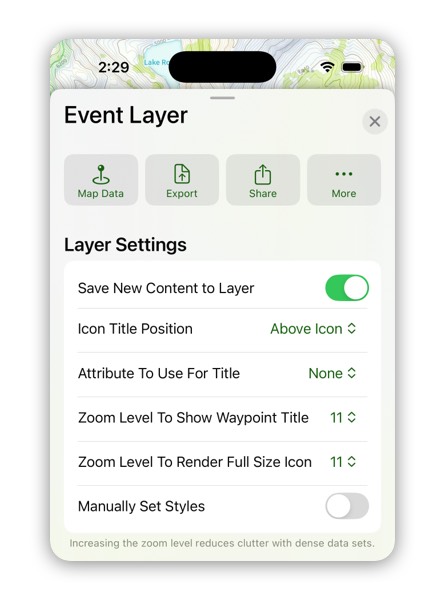
Save New Content To Layer: When this setting is turned on, whenever you add a new waypoint, route, or region it will automatically be added to this layer.
Icon Title Position: This setting controls where waypoint titles appear for all waypoints in the data layer.
Attribute To Use For Title: This setting changes which attribute is displayed as the title on the map. If you set it to “None” then the normal title is used. You can change the title attribute to quickly see the values for different attributes on waypoints.
Zoom Level to Show Waypoint Title: This setting controls when waypoint titles appear on the map. When you zoom past this zoom level waypoint titles appear.
Zoom Level to Render Full Size Icon: This setting controls when the waypoint icon is rendered at full size. If you have a dense data set increasing this zoom level, lets you distinguish between the different icons.
Manually Set Styles: When you turn on this setting, all of the waypoint, route, and region styles are manually set for each object. If you turn off this setting, you can set style rules that apply to all waypoints, routes, and regions in this layer.
Data Layer Style Rules
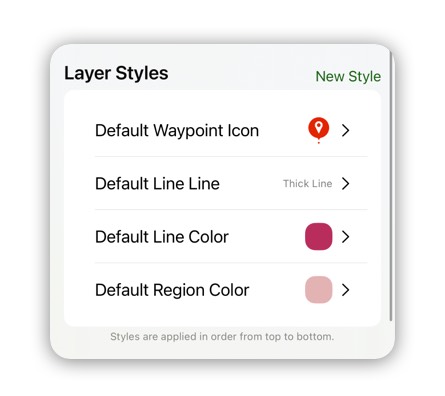
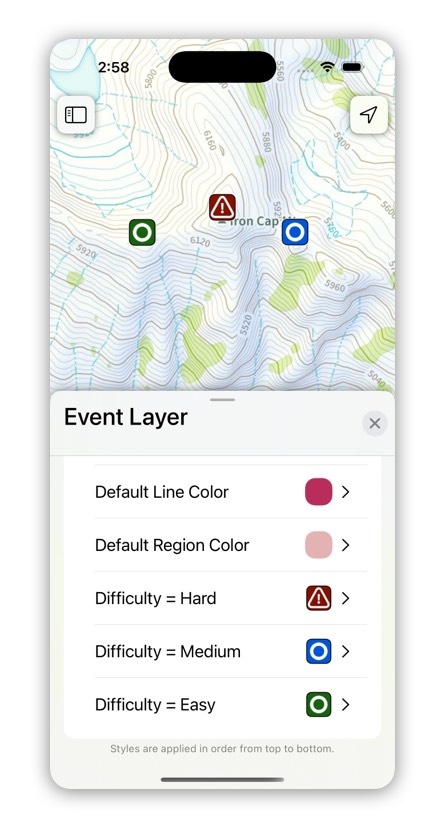
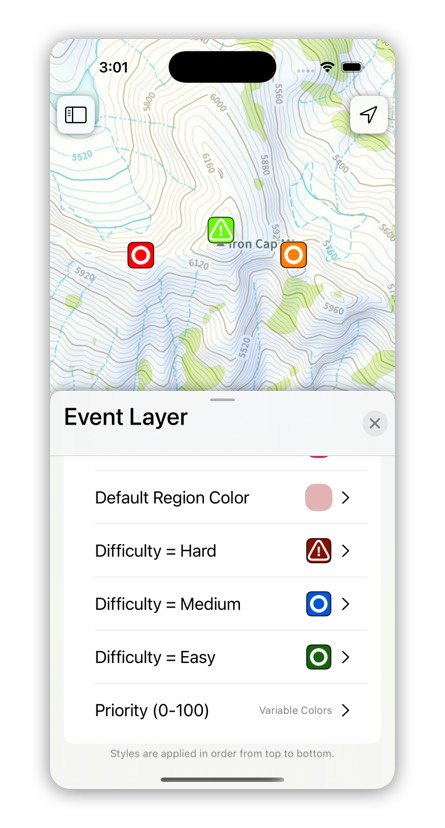
You can use the Layer Styles to control how the waypoints, lines, and regions in the data layer appear. The styles are applied in order from the top of the list to the bottom. The first style to get applied is a default style for waypoints, lines, and regions. You can tap on each of these to change the default.
In this example I changed the default waypoint icon to an orange marker and the default line color to a pink color.
To add a new style tap on “New Style”. There are four types of styles you can add.
New Icon Style: Use this style to add styles for waypoint icons.
New Line Style: Use this style to add styles for route lines.
New Color Style: Use this style to add a style that adds a color. This can apply to a waypoint icon, line, or region.
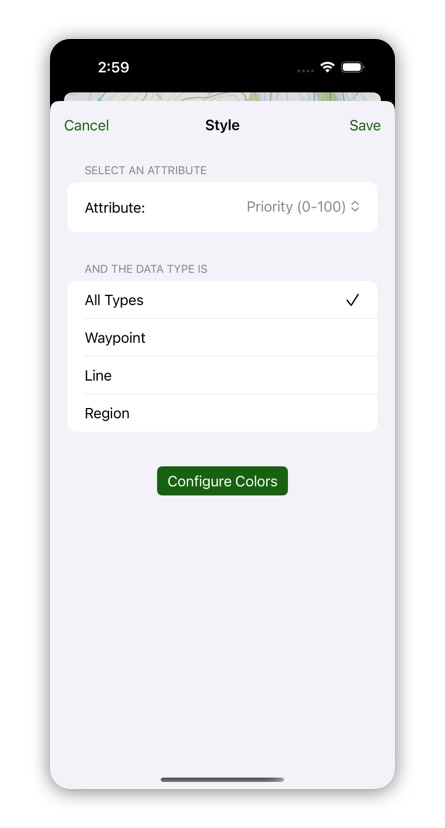
New Variable Color Style: Use this style to add a style that adds a color based on a numeric range of numbers.
For an example with variable color styling, see https://topomaps.co/share/LHVLt8p20n.
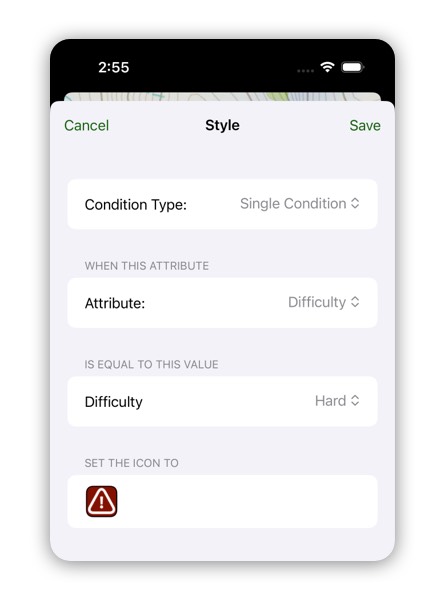
Here is an example for setting a hazard icon when the difficulty is hard.
Here is an example for setting three different icons based on the difficulty level.
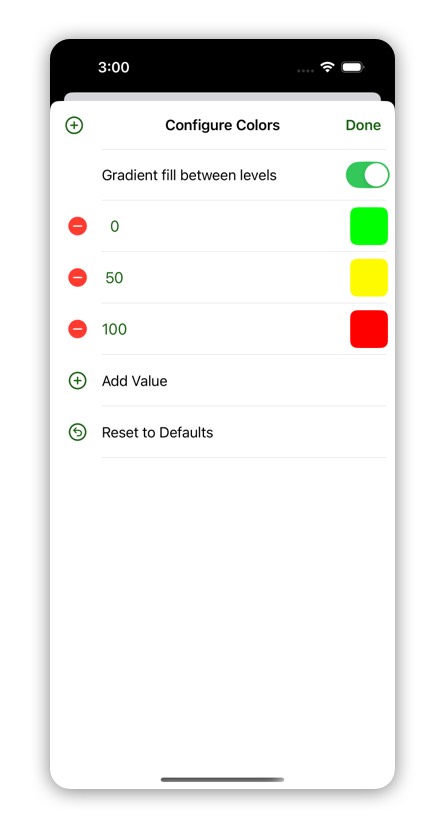
Now we can set up a variable color style for the priority attribute. We are going to set it up to do a gradient color from green to yellow to red.
Data Layer Groups
Sometimes you want to have multiple layers all share the same attributes and styles. You can do that with a Data Layer Group.
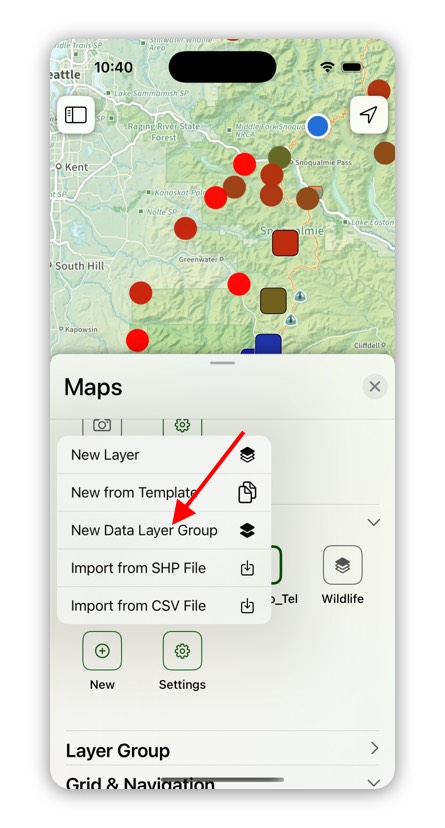
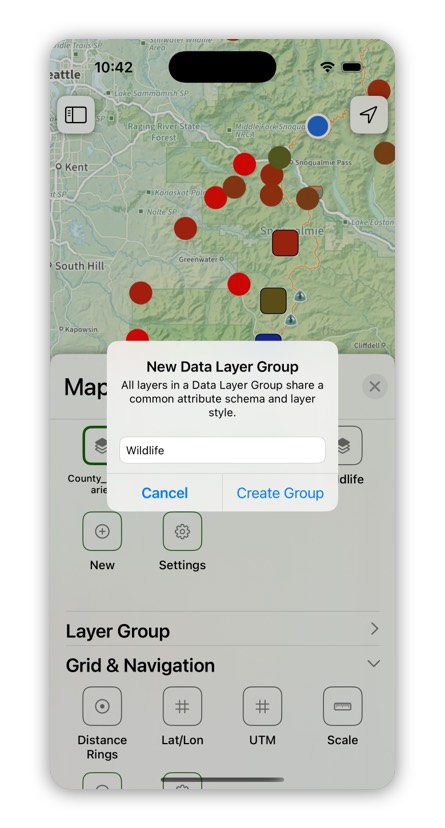
To create a new data layer group, tap on the New button under Data Layers and select “New Data Layer Group” and then give the group a name.
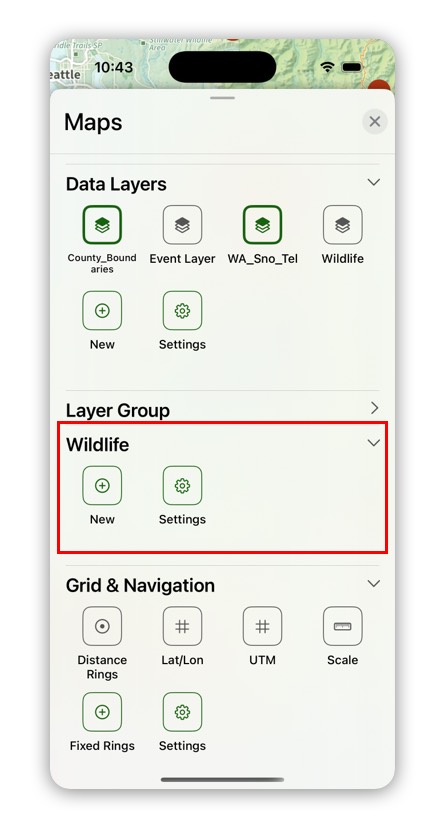
The Data Layer Group shows up as a new section in the Maps. You can add a new layer to the group with the New button.
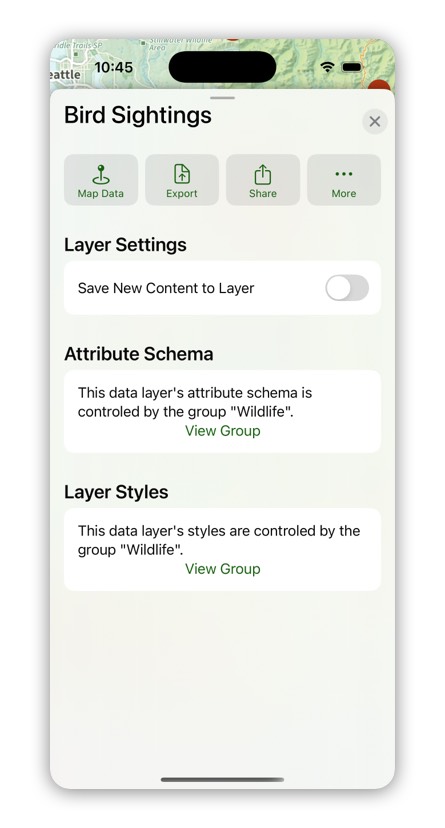
When you create a new layer in the group, that layer’s attributes and styles come from the group settings and not from the layer settings.
You can edit the data layer group’s settings by tapping on the Settings button in the data layer group section.